The Treasury’s Tax Expenditures and Insights Statement (TEIS) for 2022–23, released at the end of February 2023, provides estimates of the revenue forgone from tax expenditures, along with distributional analysis on large tax expenditures and commonly utilised features of the tax system.
In particular, the TEIS reports information about revenue forgone (i.e. revenue that the Government does not collect) through tax measures such as:
A tax expenditure arises where the tax treatment of a class of taxpayer or an activity differs from the standard tax treatment (tax benchmark) that would otherwise apply. Tax expenditures can include tax exemptions, some deductions, rebates and offsets, concessional or higher tax rates applying to a specific class of taxpayers, and deferrals of tax liability.
The estimates are provided on a ‘revenue forgone’ basis. Revenue forgone estimates measure the difference in revenue between the existing treatment and benchmark tax treatment, assuming taxpayer behaviour is the same and the existing tax treatment is removed entirely. A positive tax expenditure reduces tax payable relative to the benchmark. A negative tax expenditure increases tax payable relative to the benchmark.
Revenue forgone estimates are not estimates of the revenue impact if the tax expenditure was to be removed. In practice, taxpayers would alter their behaviour in response to the change of a policy.
The TIES lists the 52 largest tax expenditures and deductions, ranked by revenue forgone (there are 301 tax expenditures in total). The 10 largest ones are as follows:
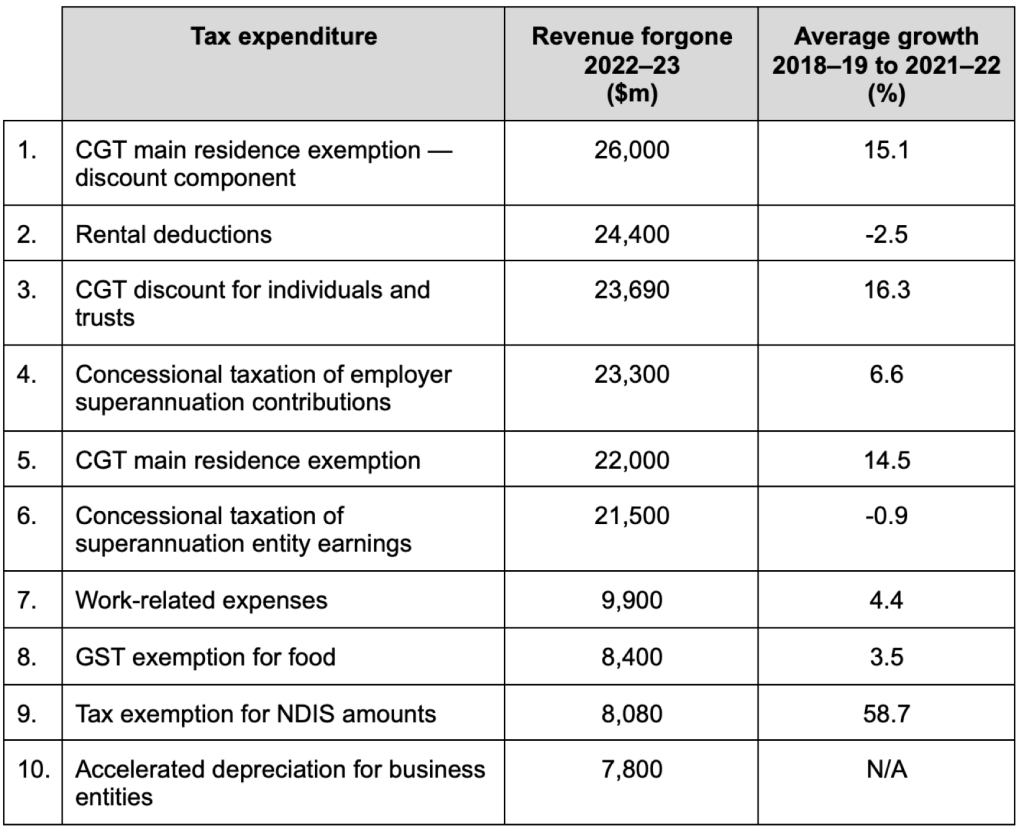
Other notable expenditures include:
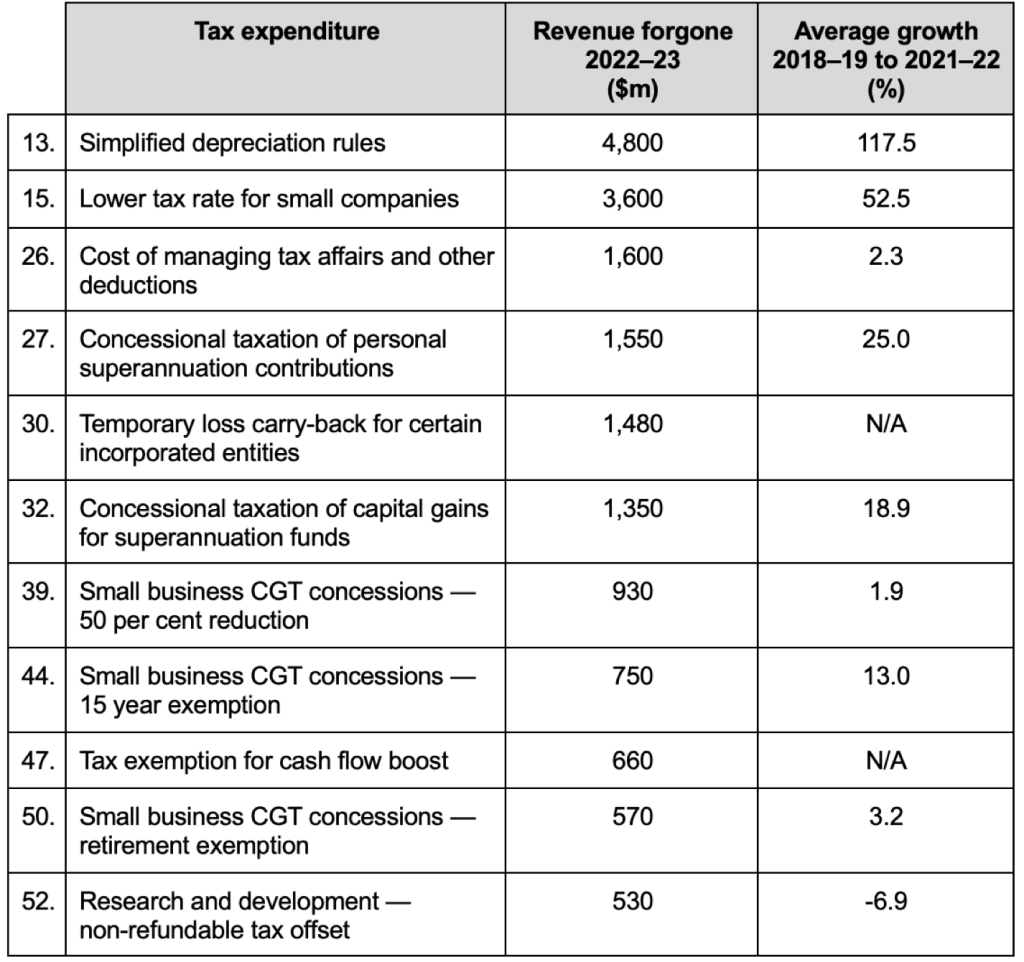
Negative tax expenditures include:

The TEIS also presents distributional analysis for large expenditures and some aspects of the personal income tax system, where reliable data is available. This informational enables comparison of the groups which utilise these futures, including by income, gender, age and industry.
A selection of the distributional analysis has been reproduced below (all tables, charts and data are sourced from the TEIS report).
Chart 2.1 Estimated number of individuals aged 15 and over by individual private income, split by whether receiving any transfer payments* and whether paying any tax (2022‑23)
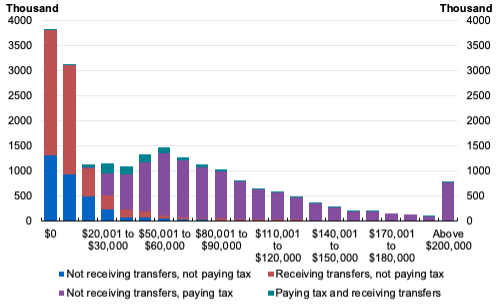
* Recipients of transfer payments here include individuals eligible for income support payments, Family Tax Benefit and the Commonwealth Seniors Health Card, but do not include other payments such as Child Care Subsidy or Paid Parental Leave.
Tax expenditures and aspects of the tax system relating to individuals are based on tax data for around 15 million personal tax filers in 2019–20 (the most recent year where the ATO’s comprehensive Taxation Statistics is available). The total tax filer population is benchmarked to meet Treasury’s estimate for 2019‑20, which incorporates late lodgers.
Over 1 million individual tax filers realised a capital gain in 2019–20; of those, over half also benefited from the CGT for individuals and trusts. Nearly 91 per cent of the total benefit was received by tax filers with above median taxable income, and 75 per cent by the top 10 per cent of tax filers.
The substantial share of the benefit that flows to the top decile is due to relatively more individuals receiving capital gains income, higher average capital gains, and a higher marginal tax rate increasing the benefit of the discount.
Chart 2.2 Share of benefit and recipients by taxable income decile, 2019–20
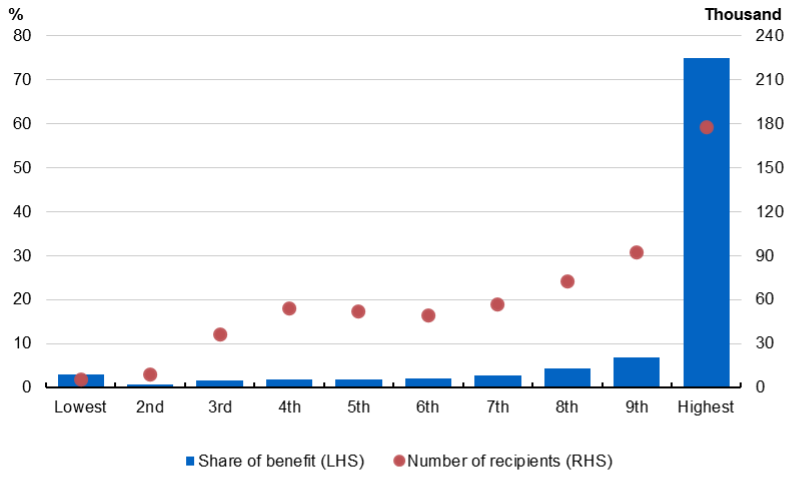
In 2019–20, 91 per cent of the benefit went to people with above median income, and 30 per cent of the benefit went to people in the top income decile. There are fewer recipients in lower income brackets because government payments, for which compulsory superannuation contributions are not required, are the main source of income for a large proportion of individuals in these deciles. The share of the benefit for people in the lowest deciles is negative because on average they face a personal income tax rate that is lower than 15 per cent. Men received an average benefit of $1,950 compared to $1,390 for women.
Chart 2.4 Share of benefit and recipients by taxable income decile, 2019–20
People with above median income receive 82 per cent of the benefit from the concessional taxation of superannuation earnings, with those in the top income decile receiving 39 per cent of the benefit. Men received an average benefit of $1,100 compared to $750 for women. 46 per cent of the benefit of earnings concessions goes to people aged 60 or older.
Chart 2.6 Share of benefit and recipients by taxable income decile, 2019–20
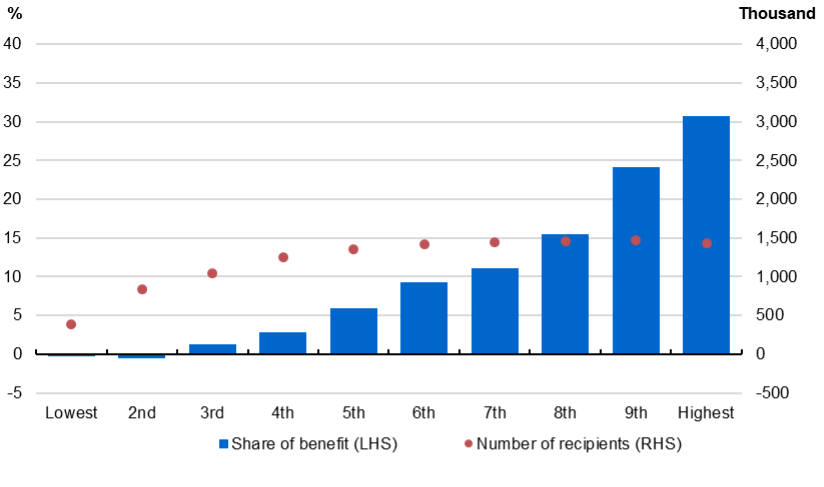
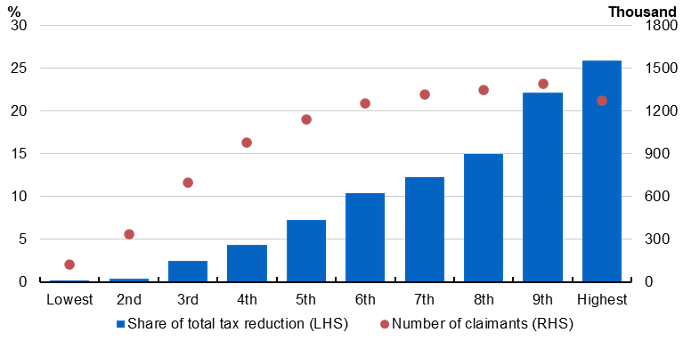
It is estimated that around 2.4 million people claimed $51.3 billion of rental deductions in 2019–20. This would result in a total tax reduction of $18.6 billion. Almost half of people with rental deductions (1.3 million) had a rental loss, which added up to total rental losses of $10.2 billion. These rental losses provided a tax benefit of around $3.6 billion in 2019–20.
In 2019–20, 79 per cent of the tax reduction went to people with above median income, and 35 per cent of the reduction went to people in the top taxable income decile. The share of the benefit for those in the lowest taxable income decile is driven by both the number of tax filers and their relatively large average deductions. These tax filers tend to have higher incomes before deductions but their claims for expenses associated with maintaining their rental property substantially reduce their taxable income, pushing them into lower deciles. The share of the total tax reduction is highest for those in age cohorts between 30 and 59 years old.
Chart 2.29 Share of total tax reduction and claimants by taxable income decile, 2019–20
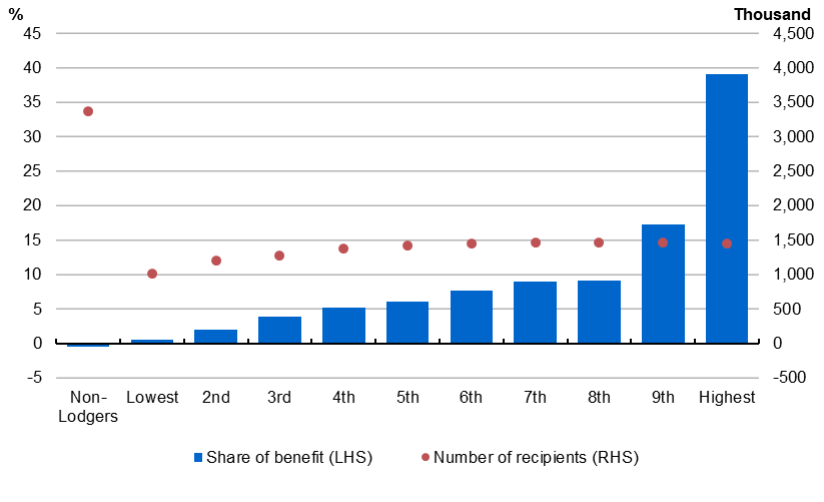
In 2019–20, 86 per cent of the total tax reduction went to people with above median taxable income, and 26 per cent of the total tax reduction went to people in the top taxable income decile. The number of people claiming work‑related expense deductions and the share of the total tax reduction rises with income. Around 71 per cent of those aged between 25 and 59 years old claimed work‑related expense deductions in 2019–20, with the largest share of the total tax reduction received by those 30 to 39 years old.
Chart 2.31 Share of total tax reduction and claimants by taxable income decile, 2019–20
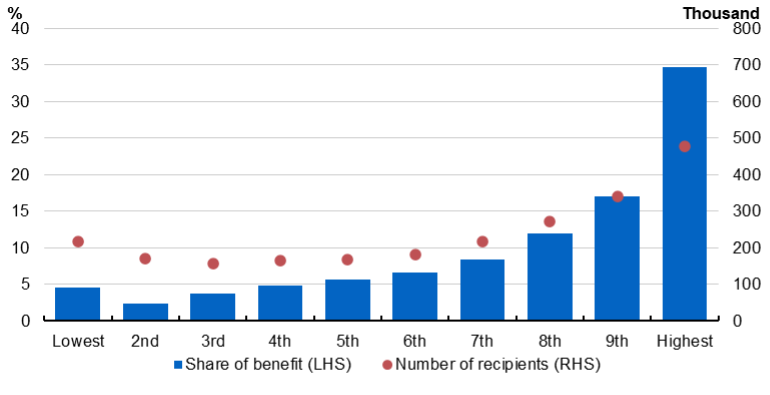
Around 1.5 million individuals reported receiving a total of almost $52 billion in net trust income in 2019–20. This was just over 10 per cent of those lodging a tax return. Around 75 per cent of individuals reporting income from trusts have taxable incomes, which includes their income from trusts and other sources, of less than $120,000.
Chart 2.35 Trust distributions by taxable income decile, 2019–20
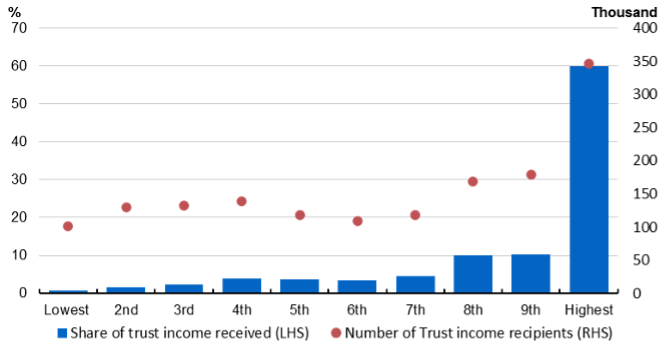
As income from trusts is ultimately taxed in the hands of the recipients, the distributions are subject to the marginal tax rates of the individual receiving the income. Examining income from trusts by average tax rates (ATRs) of recipients provides insights on how much tax is paid on trust income.
In 2019–20, around 80 per cent of income from trusts was subject to an ATR (including Medicare levy) of at least 20 per cent with almost 55 per cent subject to tax of greater than 30 per cent. There were a small number of individuals who receive significant income from trusts who have average tax rates of greater than 45 per cent.
Around 20 per cent of individuals receiving income from trusts were not subject to any tax as these individuals were under the effective tax‑free threshold.
Men received a larger share of total trust income because they received an average trust distribution of $34,980 in 2019–20, while women received an average of $32,290.
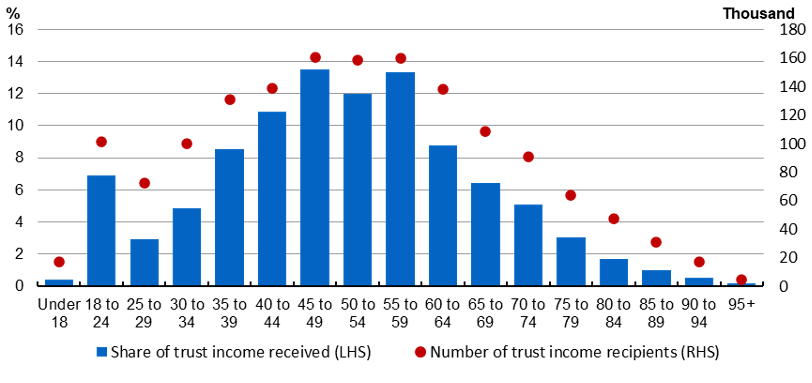
Chart 2.37 Share of trust distributions by age, 2019–20
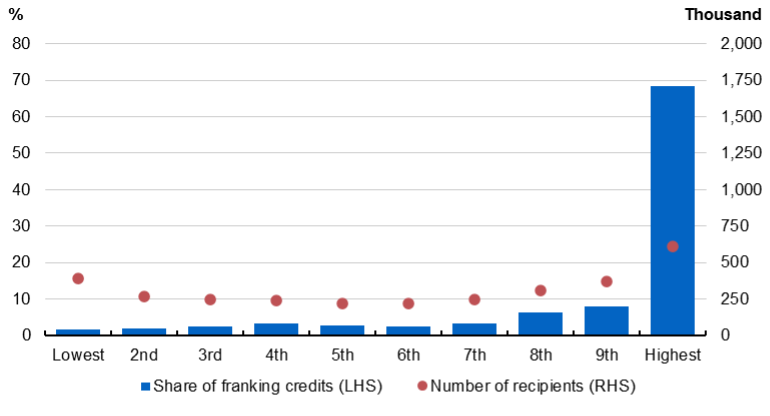
In 2019‑20, around $67 billion of franking credits were distributed by Australian companies. Around $17.2 billion of these were claimed by 3.1 million residents on their individual tax returns that year, with the remainder flowing to other local entities including other companies, superannuation funds and charities, or overseas. Of the $17.2 billion, around $10.1 billion was received directly, with the remainder coming indirectly via one or more partnerships or trusts.
Those aged 50 and over received nearly three‑quarters (72 per cent) of the credits received by individuals, with the cohort aged 75 and over accounting for the largest number of individual credit recipients (395,000), highest average amount received ($7,357), as well as the largest share of credits received in aggregate.
Chart 2.38 Franking credits received by taxable income decile, 2019–20
Join us at the beginning of each month as we review the current tax landscape. Our monthly Online Tax Updates and Public Sessions are excellent and cost effective options to stay on top of your CPD requirements. We present these monthly online, and also offer face-to-face Public Sessions at 17 locations across Australia.
Join us online
April Tax Update >
Join us at an upcoming workshop
Melbourne Tax Workshop > 13 April
Perth Tax Workshop > 13 April
Werribee Tax Workshop > 15 April
Newcastle Tax Workshop > 19 April
 Personalised training options
We can also present these Updates at your firm or through a private online session, with content tailored to your client base. Call our BDM Caitlin Bowditch at 0413 955 686 to have a chat about your specific needs and how we can assist.
Learn more about in-house training >
Our mission is to provide flexible, practical and modern tax training across Australia – you can view all of our services by clicking here.
Join thousands of savvy Australian tax professionals and get our weekly newsletter.